Friday 26 August 2011

Using a Crosstab Query to Present Summary Data

In this post we shall use the power of an Access Crosstab Query to summarize and restructure our data into a clear and concise format.  We shall illustrate how to do this with sales made by employees of a Real Estate Company (who are referred to as Estate Agents in the UK).

So in what way does a Crosstab Query improve the presentation of summary data?  Well lets imagine our Real Estate Company asks us to summarize a list of sales made by each of its employees, for each quarter, over the period of a year.  This list has fields for Employee, Quarter and SaleValue.


Figure 1: This is the raw data that will form
the basis of our Crosstab Query.
As you can see in Figure 1 above, this raw data provides us with all the necessary information, but is difficult to digest in its present form.  What we are interested in, is the total SalesValue, for each Employee, for each Quarter.  With the help of a Crosstab Query, we can restructure this information so that each Employee Name becomes a single Row Heading on the left side of the table, and each Quarter Value is grouped together to form Column Heading's across the top of the table.  Since there are three employees, and four quarters in our data, this will give us a table with three rows and four columns.  The Sum of the Sales value then appears where each Employee Row intersects with each Quarter Column.  This is how our Crosstab Query will be structured:


|Quarter 1|Quarter 2|Quarter 3|Quarter 4|
Employee 1|Sum of SaleVale|Sum of SaleVale|Sum of SaleVale|Sum of SaleVale|
Employee 2|Sum of SaleVale|Sum of SaleVale|Sum of SaleVale|Sum of SaleVale|
Employee 3|Sum of SaleVale|Sum of SaleVale|Sum of SaleVale|Sum of SaleVale|

Creating a Crosstab Query

So how do we create a Crosstab Query?

Well, there are two main ways: the first with the Crosstab Query Wizard, and the second using the Query Design Grid.  We are going to focus on the second method which involves creating the Crosstab Query from Scratch.  However if you do wish to use the Crosstab Query Wizard, you can select the CREATE TAB, click the QUERY WIZARD ICON from the OTHER group, highlight CROSSTAB QUERY from the list in the dialogue box, and then click OK.  When the Wizard starts, follow the instructions to select the Table/Query, the field to be used as Row Headings (SalesPerson), the field to be used as Column Headings (Quarter), and the aggregate function to be used to summarize the SaleValue (Sum).

However, here is the method to create a Crosstab Query from Scratch using the Query Design Grid:
  1. Select the CREATE TAB of the Access Ribbon.
  2. Click the QUERY DESIGN icon.  It is located in the OTHER group.
  3. Select the table or query to be used from the SHOW TABLE dialogue box.  The one I have used is called qrySales.
  4. Click the CROSSTAB icon.  This is located in the QUERY TYPE group of the DESIGN ribbon.  Notice how two new rows, Crosstab and Totals, appear in the query design grid.
  5. Drag the three field names from qrySales down onto the grid.
  6. Go to the Crosstab row of the  SalesPerson column on the QUERY DESIGN GRID. Then select Row Heading from the drop down box in that cell.
  7. Next go to the Crosstab row of the Quarter column.  Then select Column Heading from the drop down list.
  8. As you may recall, the sum of SaleValue is going to provide the summary data in our table.  To do this, go to the Totals row of the SaleValue column.  Then select Sum from the drop down list.  Then move down to the Crosstab row of the SaleValue column, and then select Value from the drop down list. 
The QUERY DESIGN GRID should  now look like this:

Figure 2: The QUERY DESIGN GRID for our Crosstab Query.
 When you run the Crosstab Query our results should appear like this:

Figure 3: Results of our Crosstab Sales Query.
Its worth pointing out that we can add another row heading containing a Total SalesValue for each SalesPerson across the four quarters.  To do this just go back to the grid and add an additional column for SalesValue (you might want to give the column the alias of Total).   Then select Row Heading from the Crosstab Row on the grid. When run, it should look like this:

Figure 4: Crosstab Query with additional Row Heading comprised of the row Total.


Friday 19 August 2011

Handling the Conditional: Using the IIf Function

Let's imagine we have an Access table containing a list of academic exam results.  There is a field for Subject and a field for the percentage Result , but we do not have one telling us whether each percentage result is deemed a Pass or Fail.  So what is the best way to 'store' this missing information?

Figure 1: An Access Table containing
Subject and Result fields.
We might be tempted create such a Pass/Fail field, but this is generally considered bad database design practice: since it is possible to calculate whether the student passed or failed on the basis of the percentage result, we would be storing redundant data.  Creating a Query would be a much better option.  However, we need to display whether the result is a Pass or a Fail, so simply entering a criteria to filter out all results above or below a certain percentage is not going to do the job: this would only provide us with a list of Passes or a separate list of Fails.  We just want one column stating Pass or Fail.

A great way of doing this task would be to use the IIf function as a new calculated column within the Query.  This will enable us to display a value indicating whether the exam has been passed or failed.  The IIf function allows us to specify a conditional expression (in a similar way to a query criteria), but then to go on and specify a value to be displayed based on whether the result of the expression happens to be true or false.  In our case we want the expression to determine whether the value contained in a percentage result field is, say,  greater than 50%, and if it is, display "PASS", or else display "FAIL".

The IIf function is constructed as follows:

IIf(Conditional Expression,  True_Condition, False_Condition)

The first parameter we pass for this function is the conditional expression.  In our case this would be Result > 50.  The Second parameter we pass is the string value which appears if the condition is true (for us this would be "PASS"); and the third parameter is the string value which appears if the condition is false (for us this would be "FAIL").  As such we would construct our own particular IIf function like this:

IIf([Result] > 50,  "Pass", "Fail")

We shall enter the this expression into our query as follows:

Figure 2: The IIf Function has been entered into the third column using the alias Pass.

As you can see we have entered our IIf function in the last column on the right.  We have used the alias "Pass" to describe the data to be displayed in this column.  (For more information about alias's and using functions in Access Queries, please see this explanation in relation to the DateDiff Function).  Just remember to separate the alias name from the function with a colon as shown in Figure 2 above.

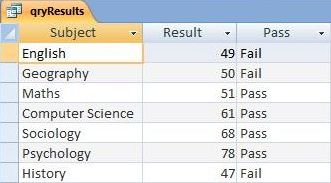
Now lets run the query and see what we get:

Figure 3: the results of our query to calculate whether
a student has passed or failed an exam.
As you can see, the IIf function has correctly assigned a Pass or Fail based on the percentage Result attained.

Friday 12 August 2011

Calculating Date Difference: Using the DateDiff Function

Suppose you want to calculate the difference between two dates.  An example of this might be a Library Management System: somebody returns an overdue library book, and receives a fine based on the number of days it happens to be late.  Our two dates in this instance would be the DueDate and the actual DateReturned.  To calculate the difference between these two dates we may use the DateDiff Function.

We could use the DateDiff Function as a Calculated Control (just put an = sign in front of it and enter the function as the textbox's CONTROL SOURCE), or within a VBA Code Module.  In this example, however, we shall use it within an Access Query.

Let's take a look at how the DateDiff Function is constructed:

DateDiff("interval", FirstDate, SecondDate)

As you can see, the function passes three parameters: these are "Interval", FirstDate, and SecondDate.  The interval parameter allows us to specify whether we want the function to return the difference in, for example, days, weeks, or years.  In our case we are interested in how many days a book is overdue, so we enter "d" as a string value. (Had we wanted the interval in weeks, we would have entered the parameter as "ww"; or years as "yyyy".  There are also a number of other options available such as quarter: "q"; hours: "h"; and minutes: "n").  The FirstDate and SecondDate parameter's refer to the two dates between which the difference is to be calculated.  In our case, these dates are contained in the DueDate and ReturnDate fields of a table called jnkLoan. As such, we would construct the DateDiff Function as follows:

DateDiff("d", DueDate, ReturnDate)

Incidentally if the book was returned early, ie the DueDate is later than the ReturnDate, the function would return the Date Difference as a negative value.  As such, the order in which the two date parameters are entered will make a difference to the return value of the function. It is the same principle as the subtraction of a smaller number from a larger number, and vice versa. With the DateDiff Function, the value of the first date is "subtracted" from that of the second, to return the date difference which we defined in the interval parameter.

So lets take a look at how we may use this function in the context of an Access Query:

Figure 1: The DateDiff Function is used in the last column on the right.

For the sake of simplicity I have used a table with just three fields - LoanID, DueDate, and ReturnDate.  However, as you can see from the screen shot above, our query has four columns.  The first three columns contain the fields of our jnkLoan table, but the last column on the right is not bound to any field; it is actually a calculation based on the DateDiff Function that we constructed above. To use the function within this query we have just had to choose an alias for the column - ie a name we make up to refer to the column.  In this example, we have used an alias called Difference.  A colon is then used to separate the alias from our DateDiff Function.

Another thing worth mentioning is how our DateDiff Function refers to the DueDate and ReturnDate fields of the jnkLoan table.  As such our Query bases the DateDiff calculation on the date values contained in the relevant record (ie that which matches the criteria set in the LoanID column) of this table.  Here is the result:

Figure 2: Results of the Query using the DateDiff Function.
The result of the DateDiff calculation is displayed in
the last column on the right.
Our query criteria selected a record containing the LoanID 427648205.  The DueDate for this record was the 08/08/2011 and the ReturnDate is 12/08/2011.  Our DateDiff Function, displayed in the last column on the right, has calculated the book is being returned four days overdue.

Friday 5 August 2011

Using the DSum Function

Today we are going to look at using the DSum Function within a Calculated Control to produce a Total Amount. The DSum Function works in a similar way to the DLookUp function which I wrote about in my last post. Both functions pass an identical set of parameters in their syntax. However, instead of looking up a field value in a table or query, the DSum Function calculates the sum of values contained in a particular field of a specified table.

So lets take a look at the syntax of the DSum Function:

=DSum("fieldName", "tableName", "criteria")

The first parameter we pass is the name of the field containing the group of values that we wish to add together as a sum.  The second parameter is the name of the table or query, and the third parameter is an optional criteria used to restrict the group of records upon which the calculation is to be made.  All the parameters are passed as strings - hence the quotation marks.

So, for example, if we had a field called Amount, and a table called tblCategories, our expression would look like this:

=DSum("Amount", "tblCategories", "fldCategory='A'")

The final parameter is the criteria string. In this example the criteria restricts the calculation to records containing the value 'A' in the fldCategory field.  As such this function would produce a Total Amount for all records allocated the category value 'A'.

So lets put all this into practice.  In figure one below I have created the tblCategories table and populated it with values.  There are four different categories A,B,C and D.  Each instance of a category has an amount value associated with it.


Figure 1: The Categories Table (tblCategories)

I then created a form with four Calculated Controls.  I used the DSum Function in each control to calculate a Total Amount for each category.

Figure 2: The DSum Function within Calculated Form Controls.

And here are the results:

Figure 2: Results of the DSum Function.